Data Analysis
Introduction
The data for this analysis was sourced from the U.S. Climate Risk Projections by County, 2040–2049 data set is a projection of 2040-2049 risk through an index that combines hazard, exposure, and vulnerability, at the county level. which provides comprehensive climate data to help understand and plan for future climate conditions. The dataset includes information on various climate variables, allowing for a detailed analysis of climate risks across different regions.
Scatter Plot

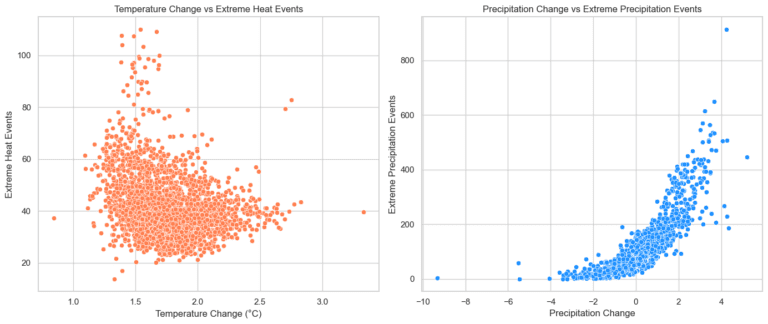
The first plot shows how increasing temperature changes are associated with more extreme heat eventsThe second plot shows that increases in precipitation result in more extreme precipitation events, while decreases in precipitation tend to result in fewer such events
Heatmap

The heatmap highlights the strong connections between climate-related hazards, socio-economic factors, and overall risk. The tight correlations between Risk, Exposure, and Vulnerability emphasize how these factors are central to climate risk assessments. Environmental variables such as temperature changes, precipitation changes, and extremes show moderate to strong relationships with human development indicators like housing density and impervious surface coverage, suggesting that urban areas may be particularly sensitive to these climatic changes.